Baseball's last competitive game before tonight was played on July 12. The rolling-30 offense rollups that feed this model were last refreshed the same day. Five days later they contain exactly the same numbers, because a rolling window does not roll when nothing happens.
That is not a bug. It is the correct behavior of a recency-weighted input during a scheduled break, and it is also the reason today's model output failed the internal QA gate and is not being sold to you as an edge. What follows is a breakdown of five positions, led by the Dodgers-Yankees under 9 at +100 and the Cleveland Guardians moneyline at -122, each built deliberately on the inputs a four-day layoff cannot corrupt: season-long run prevention, one park's structural run environment, and starter rate stats with real sample behind them.
The Disagreement, Stated Plainly
| Game | Posted total | Model projection | Direction |
|---|---|---|---|
| Dodgers at Yankees | 9.0 | NYY 4.99, LAD 4.28, combined 9.27 | Above the number |
| Pirates at Guardians | 7.5 | CLE 4.32, PIT 2.81, combined 7.13 | Below the number, Cleveland by 1.51 |
Read the top row again. The engine projects 9.27 runs at Yankee Stadium. The posted total is 9. The card is on the under. A model publication that buried that would be worthless, so it is the second paragraph instead.
Row two agrees with the card. Cleveland projects to 4.32 runs, Pittsburgh to 2.81, a combined 7.13 that sits under the posted 7.5 and a projected margin of 1.51 runs in Cleveland's favor. That output points at the Guardians moneyline. But it comes out of the same engine, on the same stale rollups, so it earns no more trust than the row above it.
What Four Dark Days Do To A Rolling Window
A rolling-30 offense rollup is a recency-weighted estimate of how a lineup is currently producing. It is the most valuable input this model has in a normal week, because it captures the thing season aggregates hide: a club that has stopped hitting, or started.
It is also the most fragile input this model has, and the All-Star break is precisely the event that breaks it. Every team in tonight's two games has played 96 or 97 games this season. The rollups treat July 12 as though it were yesterday, weighting a lineup's condition from five days ago as its condition now. They cannot see four days of rest. They cannot see a rotation reset, a reshuffled bullpen, or a hitter who used the break to fix something.
Precision matters here, so state it narrowly: the model is not wrong tonight, it is unqualified. Its inputs no longer describe the thing they claim to measure. That is a different failure from a bad projection, and it calls for a different response, which is to stop using the corrupted layer and keep using the layers that are still sound.
The Stable Inputs: 97 Games Of Run Prevention
Season-long run prevention does not care that nobody played for four days. It is built on 96 and 97 games of accumulated evidence, and it is the layer the under is built on.
| Metric | Dodgers | Yankees |
|---|---|---|
| Record | 61-36 (.629) | 54-42 (.563) |
| Runs allowed | 357 in 97 games, 3.68 per game | 371 in 96 games, 3.86 per game |
| Team ERA | 3.55 | 3.39 |
| Team WHIP | 1.14 | 1.19 |
| Opponent average | .216 | .228 |
| Team AVG / OPS | .262 / .777 | .237 / .741 |
| Team strikeouts (batting) | 757 | 867 |
Sum the two run-allowed rates and you get 7.54 runs per game of combined defensive baseline against a posted total of 9. That is a crude estimator, and it is stated as one, since it ignores park effects and tonight's particular starters. Its value is that it is unconditional. Nothing that happened between July 13 and July 16 can move it.
New York's offensive profile is the second stable pillar, and it is a study in variance. New York hits .237 with a .741 OPS and has struck out 867 times, the highest total in either of tonight's games, while hitting 142 home runs. That is a lineup whose run production is unusually dependent on the long ball, and long-ball-dependent offenses have wider game-to-game distributions than contact offenses with the same mean. Wide distributions after a layoff are exactly what an under at even money is being paid to absorb.
Relief pitching closes the case. The Dodgers post a 3.55 team ERA, the Yankees a 3.39. Neither bullpen is a leak, and both are rested. In a run-expectancy sense, the back four innings of this game project cheaper than the front five, which inverts the usual shape of a total.
The Variance Term: Sasaki's Home Run Rate
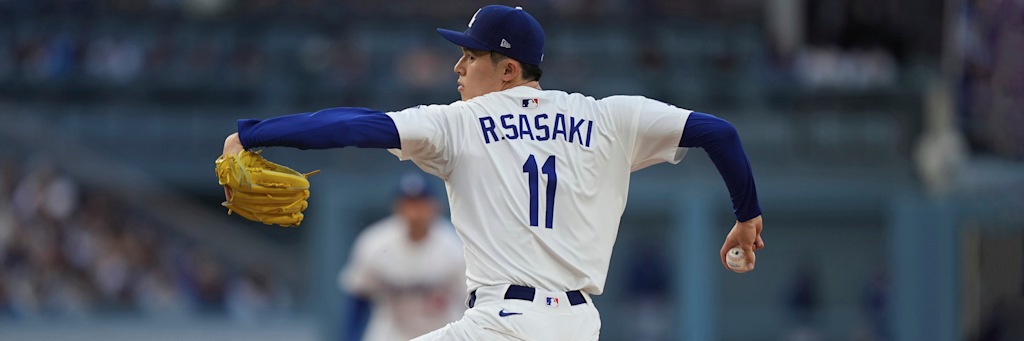
Uncertainty in tonight's Bronx projection concentrates in one man, and the number is 19 home runs in 81 innings. Better than two per nine. His supporting line is a 5.33 ERA, a 1.36 WHIP, 33 walks against 80 strikeouts, and a .247 opponent average across 16 starts.
His game log carries the tail risk in plain sight. On July 2 against San Diego he recorded nine outs and allowed seven hits, six earned runs, and three home runs. That start alone is why a model would push the Bronx projection toward 9.27 rather than toward the 7.54 defensive baseline, and any honest presentation has to concede that the engine's disagreement with the card is not arbitrary. It is Sasaki.
Counterweights exist here too, and they are measurable. On July 8 against Colorado, Sasaki went six innings and allowed three earned, and he has issued exactly one walk in each of his last two starts after walking five in San Diego on June 26. Opposite him, Gerrit Cole has a 4.04 ERA with 47 strikeouts against 11 walks in 49 innings over nine starts, and his July 8 outing against Tampa Bay ran 6.1 innings with zero home runs allowed. A walk rate that low compresses the run distribution on one half of the scoreboard regardless of what Sasaki does on the other.
Progressive Field: The Workload Case For Cleveland
Cleveland's position rests on a durability input rather than a rate input, and durability is another thing a break cannot touch.
| Starter | Line | Workload |
|---|---|---|
| Gavin Williams (CLE) | 10-4, 3.81 ERA, 1.15 WHIP, .222 opp AVG, 10.64 K/9 | 19 GS, 113.1 IP, 134 K |
| Jared Jones (PIT) | 1-1, 4.37 ERA, 1.14 WHIP, .220 opp AVG, 10.03 K/9 | 8 GS, 35.0 IP, 39 K |
Rate stats on these two are close enough to call indistinguishable. A .222 opponent average against a .220. A 1.15 WHIP against a 1.14. What separates them is sample and length: Williams has thrown 113.1 innings across 19 starts, Jones 35 across 8. On July 9 against Minnesota, Williams produced his best start of the season, seven innings with 11 strikeouts, one walk, and three hits.
Behind him, Cleveland's bullpen has converted 32 saves, more than the Dodgers, Yankees, or Pirates. Pittsburgh's relief group carries a 4.32 team ERA and a 1.32 WHIP, the weakest of the four clubs playing tonight. In games decided after the sixth inning, that gap is the position.
Cleveland's flaw is not subtle, and it is not hidden. Cleveland has scored 385 runs, a .229 team average, a .679 OPS, and 93 home runs, and the club's run differential is minus two despite a 51-46 record. A minus-two differential is the honest description of a .500 team, which is why this play is sized at one unit rather than three. Pittsburgh, meanwhile, hits .263 and scores 5.32 runs per game, both better than Cleveland.
Coors Field: The Park Term A Layoff Cannot Shrink
The third position moves to the one variable in tonight's slate that a four-day break has no power over, because it is structural rather than behavioral. Reds-Rockies over 12 at -110 takes 1.5 units on the run environment at Coors Field. Sum the two clubs' season scoring rates and the sea-level baseline is 8.92 combined runs, Colorado at 4.76 per game and Cincinnati at 4.16, and altitude is the multiplier that acts on that baseline every night regardless of who has been hot.
The starter rates widen the projection's upper tail rather than narrow it. Brady Singer carries a 4.72 ERA and a 1.47 WHIP over 89.2 innings, and a WHIP that high converts directly into baserunners, which at altitude carry a higher run expectancy per runner than they do anywhere else. Gabriel Hughes has thrown nine innings across a single start this season, a sample far too small to anchor a stable suppression prior, and a low-workload arm in this park pushes the distribution's right tail out further still. Cincinnati has hit 119 home runs, Colorado 110.
Over 12 is a high line and the price reflects it, which is why the stake is 1.5 units and not the top of the card. The 52.4 percent break-even at -110 is cleared not by a projected mean above 12 but by the fat upper tail a park term this large attaches to the whole distribution.
Baltimore Team Total Under 4.5: Isolating One Lineup's Run Distribution
A team total is the cleanest object a run model produces, because it isolates a single lineup's scoring distribution and asks only where the line sits inside it. Baltimore Orioles team total under 4.5 at -133 takes 1 unit. Baltimore's season mean is 4.61 runs per game on a .239 average and a .722 OPS, so a line of 4.5 is posted almost exactly at the club's central tendency.
Peter Lambert is the term that shifts the distribution left. Houston's right-hander runs a 3.14 ERA and a 1.12 WHIP with 81 strikeouts in 86 innings, and a sub-1.15 WHIP lowers both the mean and the variance of the runs an opposing lineup plates against him. Daikin Park with the roof shut is a neutral run environment, so no park term pushes back the other way. The 57.1 percent break-even at -133 lands on the under side of a distribution already centered below the line.
Texas Team Total Under 3.5: The Strikeout-Rate Anchor
The largest position on the card is the one with the widest sample behind its key input. Texas Rangers team total under 3.5 at -140 takes 3 units, and the input is Chris Sale's strikeout rate: a 2.20 ERA, a 1.11 WHIP, and 117 strikeouts across 98 innings, better than ten per nine and the highest whiff rate of any starter on tonight's board.
Strikeouts are the most run-suppressive event a model tracks, because they remove balls in play entirely and compress the lower half of a lineup's scoring distribution toward zero. Texas scores 4.16 runs per game on a .245 average and a .719 OPS, an ordinary offense with no structural counter to a left-hander missing bats at Sale's clip. A line of 3.5 sits well beneath the club's mean, and against this rate profile the distribution collapses toward the under. The 58.3 percent break-even at -140 is the reason this is the three-unit play rather than a token one.
What Beats These Numbers
Tonight's under loses if the engine's 9.27 is right and the defensive baseline is the naive estimator, which is a live possibility: Sasaki has allowed 19 home runs in 81 innings and the Yankees have hit 142, and July 2 in San Diego is what that collision looks like. The Guardians play loses to Jared Jones, who threw six hitless innings against Atlanta on July 8 with eight strikeouts and no walks, matched against an offense with a .679 OPS and a minus-two run differential. Pittsburgh is 7-3 in its last ten. The deeper caveat applies to everything above: no model on earth has a clean read on how nine idle lineups look tonight, and the rolling windows that would normally answer that question have not updated since July 12. These are positions taken on stable inputs with the unstable layer switched off, not validated projections. The Coors over carries the inverse risk of the two unders: it loses to a low-variance pitchers' duel that the park's own history makes uncommon but never impossible. The Baltimore and Texas team-total unders share one failure mode, a single early crooked inning against Peter Lambert or Chris Sale that lifts one lineup past its line before the rate advantage can express itself over nine innings. Lineups were not final at publication.
Final Verdict
The July 17 model card publishes five positions and one admission. The Dodgers-Yankees under 9 at +100 takes 1.5 units on a 50 percent break-even, built on a combined 7.54 defensive baseline, two bullpens at 3.55 and 3.39, and a .237 Yankee lineup with 867 strikeouts walking out of a four-day layoff. The Cleveland Guardians moneyline at -122 takes 1 unit on a 55.0 percent break-even, built on the only starter in either game with a full season of innings behind him and a bullpen with 32 saves. The three run-total positions lean on inputs a layoff cannot touch: the Reds-Rockies over 12 at -110 takes 1.5 units on the structural run environment at Coors, the Baltimore Orioles team total under 4.5 at -133 takes 1 unit on Peter Lambert's 1.12 WHIP, and the Texas Rangers team total under 3.5 at -140 takes 3 units on Chris Sale's 117 strikeouts in 98 innings. The admission is that the engine's own projection for the Bronx sits at 9.27 and disagrees, and that its rolling offense inputs are five days stale, so its output is being treated as unqualified rather than authoritative today. For more on how these inputs are built, see the July 12 run column model, the expected stats guide, the BABIP regression guide, the MLB advanced stats guide, and the full model archive.