Brewers vs Yankees Prediction, August 3, 2026 | Brewers moneyline
Decomposing Two Favorites: The Arm Versus The Roster
Published August 3, 2026 | Component Model Breakdown | MLB Prediction Data Lab
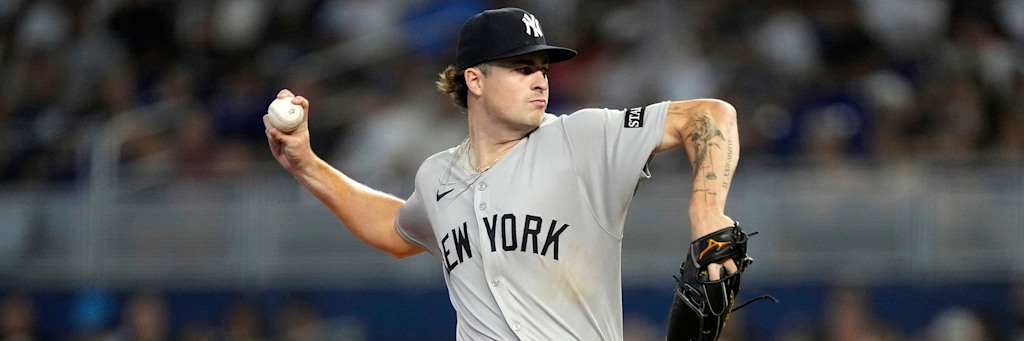
Cam Schlittler has walked 26 batters this season. He has struck out 165. A 6.35 strikeout to walk ratio across 136.2 innings is the kind of separation that shows up in a win probability model as a single dominant term, and tonight the Yankees are priced accordingly. Ninety minutes earlier in Milwaukee, a team with a better record than the Yankees will send out a starter with a 5.05 ERA and still be favored. Both of those are correct prices. They are correct for opposite reasons, and a model that cannot tell them apart will size both tickets identically and be wrong on at least one.
The Framework: Splitting A Moneyline Into Its Parts
Any team win probability decomposes into a handful of terms: what the starter suppresses, what the lineup produces, what the bullpen protects, and the park and schedule context wrapped around all of it. The useful diagnostic is not the size of the total. It is the distribution. A favorite whose edge sits almost entirely in one term is fragile in a specific way, because a single short start collapses the whole estimate. A favorite whose edge is spread across four terms is durable, but it also has a lower ceiling, because no component is doing anything extraordinary.
The cleanest way to measure a starter's contribution is against his own staff rather than against the league. It controls for park, defense and catching in one step. Run the two games on tonight's card through that filter and they land at opposite ends of the scale.
Milwaukee: A Starter Term That Is Actively Negative
Brandon Sproat carries a 5.05 ERA. The Milwaukee staff carries a 3.48. He is 1.57 runs per nine worse than the group he belongs to, and the home run component drives most of that gap: 17 home runs in 92.2 innings works out to 1.65 per nine, against a team rate of exactly 1.00 per nine across 991.2 innings. Sixty five percent above his own staff.
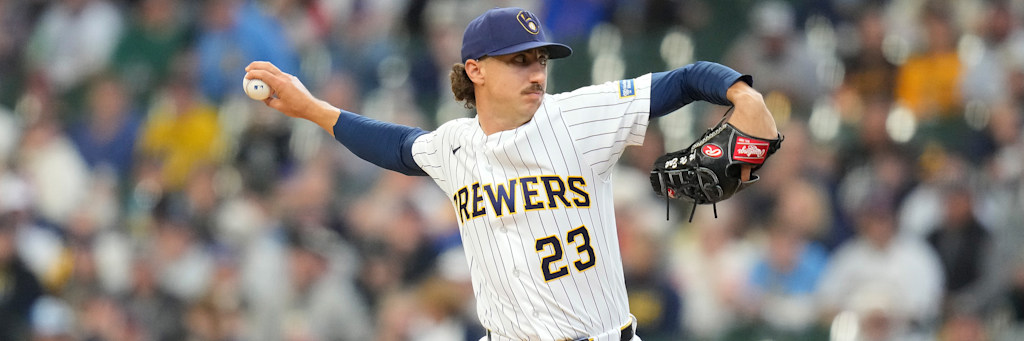
His arsenal distribution says the same thing from a different angle. Sinker 25.2 percent, four seamer 24.7, cutter 22.4, curveball 10.1, sweeper 9.7, changeup 8.0. No offering above 26 percent. A near-uniform six pitch distribution is what a model reads as an absent put-away pitch, and it fits the profile: 9.32 strikeouts per nine paired with 4.47 walks, which is stuff without a plan.
Every other term in Milwaukee's decomposition is strongly positive. Run differential is plus 135, from 555 scored against 420 allowed. Pythagorean expectation on those inputs returns a .636 win rate, which over 111 games projects to roughly 70.6 wins. Milwaukee's actual record is 69-42. The club is running very slightly below what its run prevention deserves, not above it, which means the 69-42 mark is not a mirage held up by close-game luck.
Bullpen availability is the term the market prices last and the one that matters most tonight. Milwaukee's relievers have thrown eight innings across the previous three days and only one of those came Sunday. Pittsburgh's relievers threw fourteen in the same window, including six on Sunday after Mitch Keller allowed seven earned runs in two innings. In a game where the projected starter workload is short on both sides, a six inning gap in three day bullpen usage is a measurable edge that no season-long ERA captures.
New York: A Starter Term Doing Almost All The Work
Cam Schlittler runs a 2.04 ERA against a Yankees staff ERA of 3.28, so he is 1.24 runs per nine better than his own group. The rate stats underneath are more extreme than the ERA. A .196 opponent batting average, a .243 opponent on base percentage and a .561 OPS against, compared with a .225 team opponent average. His 0.91 WHIP means fewer than one baserunner per inning through hits and walks combined.
Velocity distribution explains the mechanism. Four seamer 44.5 percent at 97.9 mph, cutter 26.5 percent at 94.6, sinker 19.4 percent at 97.7. Adding those three gives 90.4 percent of his pitches arriving at 94 or above. Hitters cannot sit on the fastball because the cutter occupies the same tunnel eight ticks of movement away, and the results follow: 7.1 innings, three hits, no runs, twelve strikeouts and zero walks at Philadelphia on July 24.
Michael McGreevy is the opposite kind of misread. His 4-9 record is a lineup artifact. Measured the same way, his 3.57 ERA against a St. Louis staff ERA of 4.14 makes him 0.57 runs better than his own group, and his 2.25 walks per nine is the best control mark of the four starters pitching tonight. St. Louis has scored 483 runs in 112 games, 4.31 per game, the lowest figure among the four clubs involved. That is why he loses.
Strip out his July 28 outing against the Cubs, seven earned runs in 1.2 innings, and his season ERA falls from 3.57 to 3.07. One start moving a full-season rate by half a run is itself a signal that the sample is still small enough to be fragile in both directions.
The Residual: What The Sequencing Record Says, And What It Does Not
Close-game records are the noisiest thing on a team page, and they cut against the larger ticket tonight. New York is 1-8 in extra innings and 13-16 in one run games. Milwaukee is 8-3 in extras and 17-14 in one run games. Read naively, that is a Yankees club that cannot finish and a Brewers club that can.
Read honestly, it is nine games. A 1-8 extra inning record over nine trials has an enormous confidence interval and close to zero predictive weight on game 113. Teams do not have a stable talent for winning tenth innings. What the split does establish is a conditional risk rather than a forecast: if this game reaches the ninth inning tied, the Yankees have shown no evidence of an edge there, and a -192 ticket has already surrendered most of its margin by that point. The correct use of that number is to weight the requirement that Schlittler pitch deep, not to shade the win probability itself.
There is one more counterpoint the Milwaukee side has to absorb. Pittsburgh has outscored Milwaukee this season, 578 runs to 555, and carries a .751 team OPS against Milwaukee's .736. The Pirates' problem is run prevention, a 4.31 staff ERA and 548 runs allowed. A model built only on offensive inputs would make Pittsburgh the side tonight. The Brewers ticket is a bet that run prevention and bullpen rest outweigh a 23 run seasonal offensive gap over nine innings, which is defensible at 1.5 units and would not be at three.
Break-Even Requirements And Sizing
-139 implies a break-even win rate of 58.2 percent. -192 implies 65.8 percent. The gap between those two thresholds is 7.6 points of required accuracy, and the component read says the Yankees clear their higher bar more comfortably than the Brewers clear their lower one, because a single dominant term with a 0.91 WHIP behind it is easier to trust for six innings than a diffuse edge assembled from four smaller ones.
The staking runs the other way from the confidence, deliberately. Two units on New York, one and a half on Milwaukee, 3.5 total. The Yankees get the larger stake because the dominant term is verifiable every fifth day. The Brewers get less because the argument depends on a bullpen sequence that has not happened yet.
Every record, ERA, WHIP, opponent average, pitch usage rate, bullpen appearance and venue dimension in this breakdown was pulled from live league statistics feeds this session and cross-checked against a second independent source before publication. Win percentage expectations and rate comparisons are computed from those pulled inputs rather than quoted.